
Introduction
Main Features of Report and Dashboard Plugin:
Configuration Management:
- Enable/Disable Report & Dashboard Extension feature from the Configuration Page.
- Add new/custom folders and display records based on folder selection.
- Edit and delete custom folder names from the Configuration Page.
Report Generation:
- Quickly generate Chart, Detail, and 2D Widget Reports from the Configuration Page.
- Set AND/OR conditions between Primary and Subpanel Module fields.
Chart Customization:
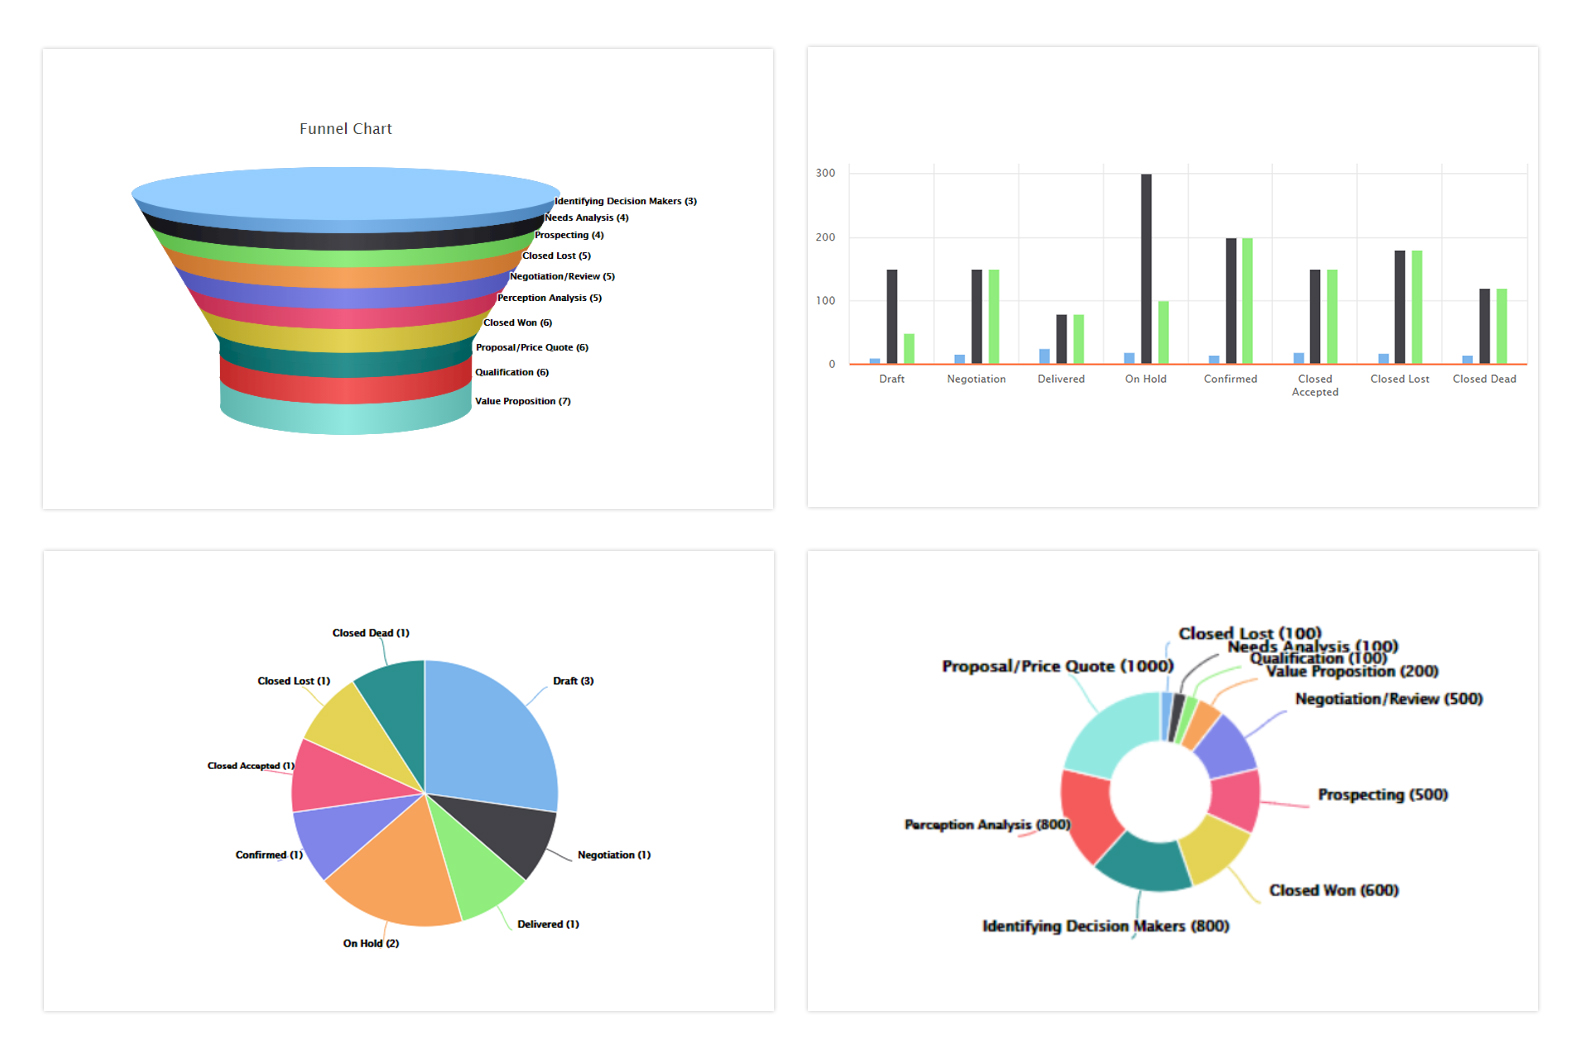
- Support for multiple chart types:
- Pie, Bar, Line, Stacked Bar, Stacked Column, Funnel, Donut, Pyramid, Column Pyramid, Stacked Column Pyramid, Stacked Bar Pyramid, Cylinder Chart.
- Customize chart dimensions:
- Legend position, display label, grid display, number formatting, horizontal line drawing, and sorting field values.
Report Sharing and Duplication:
- Share reports with specific users or user groups.
- Create duplicate records of reports from the Detail View of the Configuration Page.
Export Options:
- Export Chart Reports as PDF.
- Export Detail and 2D Widget Reports as PDF, Excel, and CSV.
Report Display:
- Display reports on the sidebar of a module if enabled and shared with specific users.
- Pin reports to SuiteCRM Dashboard in default and custom tabs from ListView or DetailView.
Interactive Features:
- Clickable chart slices redirect to the corresponding module’s ListView, displaying matched records.
- Edit, delete, preview, and change header colors for all report types (Chart, Detail, and 2D Widget) on the Dashboard.
Email Reporting:
- Send emails of all report types to users through a scheduler configured during the report and dashboard setup.
Module Support:
- Supports all standard and custom modules.
Why You Should Use the Report and Dashboard Plugin:
Dealing with a lot of disorganized data? The Report and Dashboard plugin makes it easy to manage and see the data in a way that helps you make better decisions. Instead of just getting summaries, you can dive deeper into the data.
Why this plugin is a must-have:
- No Tech Skills Needed: Anyone can use it to create clear, detailed reports in a few clicks. No need for technical skills.
- See Data Clearly: Visual reports help you see trends and make decisions faster.
- Easy to Share: You can quickly share reports with your team or managers.
- Automated Emails: You can set up the system to send out reports automatically by email, so everyone stays updated.
Make Decisions Fast with Real-Time Data:
The Report and Dashboard plugin from Variance InfoTech gives you everything you need to make smart business decisions. Whether you’re creating visual reports for meetings or need detailed data exports, this plugin has got you covered.
Here’s what you can do with it:
- Create custom reports and pin them to your dashboard.
- Export charts to share them with others.
- Interact with widget charts and find matching data records.
- Organize your reports into folders for easy access.
Try It Yourself:
Want to see how it works? You can try it out in our live demo: Click Here to Demo.
Conclusion:
If you’re dealing with messy CRM data and need a tool to help you get more detailed reports, then the Report and Dashboard plugin is perfect for you. With lots of chart options and an easy-to-use setup, you’ll turn your CRM into a tool that helps you understand your data better and make smarter decisions.
Ready to boost your reporting? The Report and Dashboard plugin can help!
Do You Need more information?
For any further information / query regarding Technology, please email us at info@varianceinfotech.in
OR call us on +1 630 534 0223 / +91-7016851729, Alternately you can request for information by filling up Contact Us
 Please wait...
Leave a Reply